The housing market has been on a tear lately. Below I’ll review recent price changes, what’s been driving them and what we can expect in the near future.
Home prices (as measured by the median price per square foot) are up strongly for the year to date through April, by around 9 percent for detached homes and 10 percent for condos. Here’s a look at the price per square foot since the March 2009 trough:

Note that the yellow line denoting condos exhibits some pretty wild swings. For that reason, I like to focus more on the much steadier detached home figure in red, which shows a fairly consistent rise in recent times.
It’s possible that the median price per square foot could be overstating price increases a little if there has been a “quality shift” wherein people are on average buying nicer homes. (We won’t know for sure until the release of the Case-Shiller index, which mitigates the quality-shift issue by measuring same-hole sales — here’s an old-timey article on the subject of measuring home prices for those interested in going down the rathole).
Regardless, it’s clear that a strong uptrend in home prices has been under way for a while now.
Here’s a look at the same price data starting at the peak of the housing bubble in 2005:

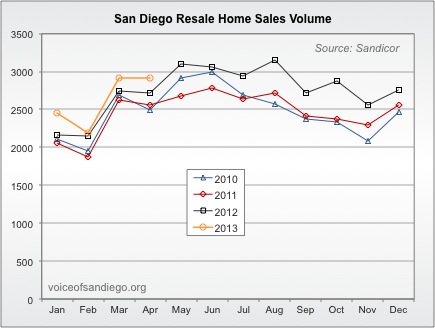
Fairly robust housing demand has certainly helped prices:
However, much more significant has been the exceedingly low level of supply:

This graph, which shows supply on a single line going back to 2007, shows how dramatic the decline in for-sale inventory has been:

We can combine supply and demand into a single figure by measuring months of inventory (the number of months it would take to sell all the currently available inventory at the current pace of sales). Thanks to a combination of fairly strong demand and extremely low supply, the months of inventory figure has plummeted:


Inventory got as high as about 15 months during the housing bust. Now it stands at under two months.

The reason I am so interested in months of inventory is that it has historically been highly correlated with price changes, and thus can provide a clue as to where prices may go in the near term. This is demonstrated in the following graph, which shows months of inventory in blue and monthly home price changes in red. (Inventory has been inverted, such that high inventory appears low on the graph and vice-versa, to make the correlation more clear).
The inventory decline that started in early 2012 hinted at the price increases to come. Since then, months of inventory has dropped relentlessly, recently hitting a new low in the history of the data I have. If the typical relationship between months of supply and home prices remains intact, we can expect further upward price pressure in the months immediately ahead.