The latest Case-Shiller data, released last week, provided a not-very-clear picture of home price trends.
The overall index fell by .9 percent between October and November. There was some serious divergence amongst price tiers, though: the high tier fell by a mild .4 percent, the middle tier was whacked for 1.7 percent, and the low tier was actually up by .4 percent.
The seasonally adjusted data was even more ambiguous. The adjusted aggregate index was down just .4 percent, the middle tier fell by 1.2 percent, and the high and low tiers were up .5 percent and .2 percent respectively. (The seasonal adjustments seem to affect different tiers differently, which may have something to do with prevalence of foreclosures, but is still kind of strange).

While there were some mixed signals underneath the surface, it looks like November was a down month overall for prices as measured by the Case-Shiller index.
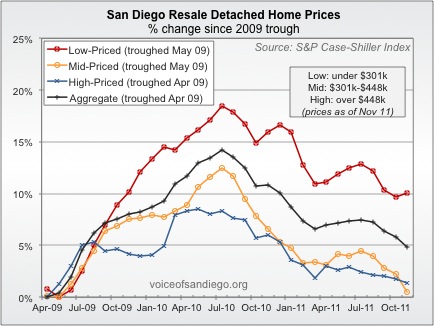
Here are some longer-term views. The first dates back to the peak of the housing bubble and shows that prices are still above the lows set in early 2009:

The second chart shows inflation-adjusted prices since the bubble peak:

Once inflation is taken into account, all but the low tier have hit new lows. The inflation-adjusted aggregate index was down 47.4 percent from the peak as of November.
And finally, here is a look back to the beginning of the data series, again adjusted for inflation:

The last time the inflation-adjusted Case-Shiller index was lower than in November 2011was, believe it or not, December 2000. While it was an interesting ride, point-to-point, real San Diego home prices have gone nowhere for 11 years.
Rich Toscano is a financial advisor with Pacific Capital Associates*. He can be contacted at rtoscano@pcasd.com.