A lot of local news and community discussions of crime focus on statistics. Is crime going up or down? Which crimes are becoming more common? And what are police doing about it?
At Politifest last weekend, I tried to provide a few answers to those kinds of questions in a six-minute, graphics-heavy presentation. I talked about broad crime trends, murders in the city and one of the Police Department’s crime-fighting tactics.
Here’s a quick recap with a dozen infographics and links to more information.
Gauging Crime Trends
There are tons of different ways to measure crime but the most common is the FBI’s crime index. It defines categories of crime that law enforcement agencies use to pinpoint and compare trends.
When police officers, city officials or news reporters say crime is going up or down, they are usually talking about changes in the FBI’s crime index. The graphic below shows the total number of major crimes in San Diego since 1950, according to the index. Major crimes include murder, rape, robbery, aggravated assault, burglary, theft and motor vehicle theft.

In some cases, the index is broken down into two categories: violent crime and property crime. The first tracks the number of murders, rapes, robberies and aggravated assaults. The second tracks the number of burglaries, thefts and motor vehicle thefts. (Theft is stealing. Burglary is breaking into a building and stealing. Robbery is stealing with the threat or use of violence.)
The next two graphics illustrate how crime has changed in the two subcategories. The overall crime pattern is nearly the same. Crime climbed until the 1980s, fell for a few years, spiked in the 1990s and then dropped precipitously.


All three of the graphics above illustrate annual crime totals reported by San Diego police. They don’t take population into account. As illustrated below, the city’s population has grown dramatically since 1950.

When authorities describe a crime rate — as opposed to just crime — they are normally talking about the number of crimes per capita. The graphic below compares the crime rate in San Diego to the entire nation.

Tracking Murders in San Diego
The number of murders reported by police each year has generally followed the city’s overall crime patterns. The graphic below shows murders since 1950.
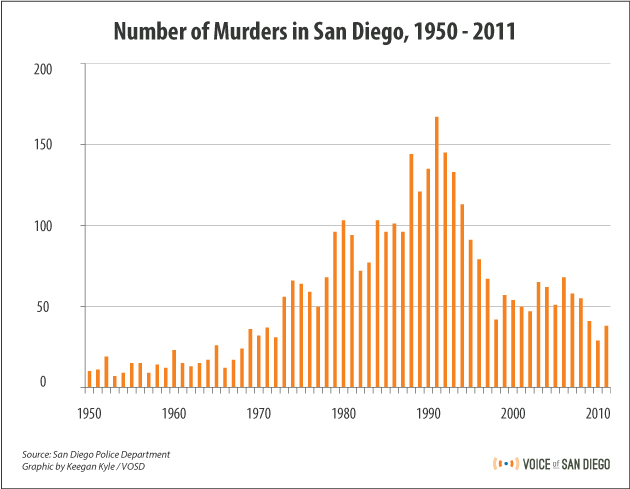
With 38 murders last year, San Diego registered far below most major cities. Police reported 89 murders in San Antonio, 116 in Phoenix and 324 in Philadelphia last year. The population of all three cities is similar to San Diego. Only San Jose, with 39 murders last year, came close to San Diego.
One of the starkest comparisons, however, is just across the border. In 1990, San Diego and Tijuana had a similar number of murders. But as the number fell in San Diego, it climbed in Tijuana and spiked in 2006 when Mexican law enforcement launched an aggressive campaign against the drug cartels.

The broad trend of declining murders doesn’t mean San Diego is without challenges today. The graphic below illustrates how the number of gang-related murders has climbed this year.

The toll of gang-related murders isn’t felt uniformly across the city. The next graphic illustrates the location of 70 gang-related murders between January 2007 and June this year, according to homicide detectives. Most have occurred in southeastern neighborhoods or neighborhoods around City Heights.

The Police Department’s Curfew Sweeps
Gang violence is one reason police have increased their enforcement of the city’s 10 p.m. curfew. They argue that physically removing minors from nighttime streets will prevent them from becoming victims or perpetrators of crime.
The strategy is unusual among California law enforcement agencies. While San Diego police doubled curfew arrests between 2007 and 2010, the number of curfews arrests fell dramatically across the state.

The Police Department’s strategy is also targeted. Police have regularly conducted the operations across the city’s urban core. This area includes high crime neighborhoods but also some of the city’s poorest and most racially diverse families.
Earlier this year, I analyzed mountains of juvenile crime data to gauge whether the sweeps were actually cutting juvenile crime. The graphics below illustrate where the sweeps happened, how many arrests police made and some of my findings.
It’s unclear whether the sweeps are responsible for less crime. Though crime has fallen in neighborhoods where police regularly conduct the sweeps, crime has also fallen by greater margins where police don’t do them.

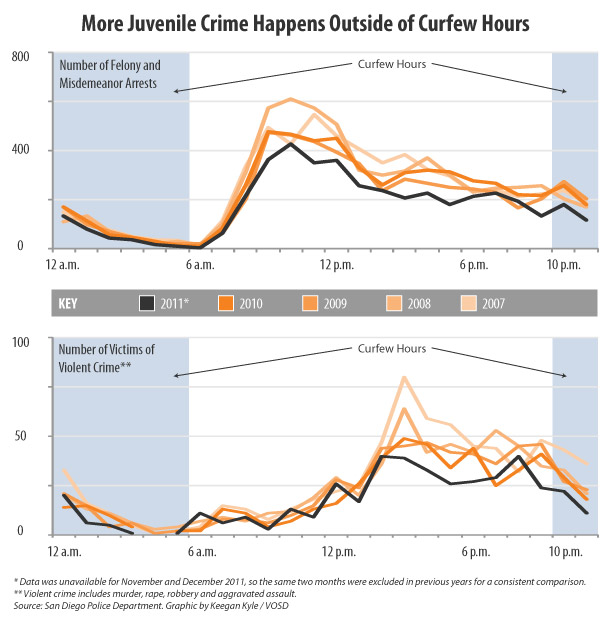
It’s also important to understand that curfew sweeps don’t address when most juvenile crime happens. The next graphic shows police have reported far more crime during daytime hours.
For more information on the Police Department’s curfew sweeps, watch the video below and read my full investigation. The video, produced in partnership with NBC 7 San Diego, provides an overview of the operations.
Keegan Kyle is a news reporter for Voice of San Diego. He writes about local government, creates infographics and handles the Fact Check Blog. What should he write about next?
Please contact him directly at keegan.kyle@voiceofsandiego.org or 619.550.5668. You can also find him on Twitter (@keegankyle) and Facebook.
Like VOSD on Facebook.