The supply of San Diego housing for sale has abruptly tightened, reaching levels that have historically portended of near-term price increases. I’ll discuss that more below, but first, let’s look over the February resale data.
The median price per square foot for San Diego resale homes was mixed — up 2.0 percent for the month for single family homes, and down 4.3 percent for condos. Overall, prices by this measure were up by .3 percent in February — close enough to flat.

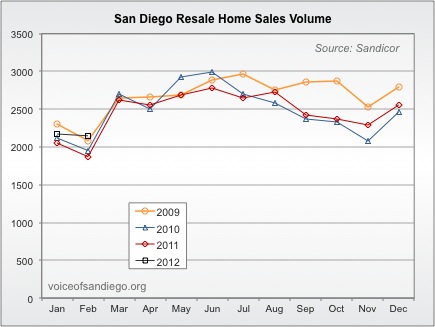
Closed sales were also pretty close to flat, which is unusual for February, which usually sees a drop:
And pending sales rose to a level higher than in any recent Februaries past:

The real story, however, was in inventory. The number of homes for sale fell — also unusual for February — to a level 20.5 percent below a year prior.

Housing supply is even tighter than the above numbers would indicate, as the amount of “contingent” inventory (typically short sales or foreclosures that have had offers accepted but not yet approved by the lenders — more here) has been growing. Since contingent properties are effectively off the market during the time they are contingent, more of this type of inventory means less inventory actually available for buyers. This latter type of property — “active” inventory — is actually down 33 percent from a year ago.
The number of months’ worth of (total) inventory dropped to 3.8 months. This is very low compared to recent years:

Months of inventory is an important statistic. Some readers may recall the chart below, inspired by the economics blog Calculated Risk and first discussed in this Nerd’s Eye View post. The blue line in this chart tracks months of inventory (inverted, so that the correlation with price changes is more obvious to the eye). The red line shows the annualized monthly change in home prices (according to the Case-Shiller index, and then my estimate of the Case-Shiller index for the most recent two months):

It’s clear that there has been a good correlation between months of inventory and home price changes. In addition to the directional similarities, there appears to have been a dividing line of about 6 months’ worth of inventory (the thick black line) which has tended to separate periods of price increases from those of price decreases.
The relationship has only really broken down twice over this time period. The first was in late 2008 and early 2009 when inventory got a lot tighter, but prices continued to plummet. I theorized the following in the afore-linked article:
There is an obvious candidate for this discrepancy: the fact that the economy was more or less imploding during that same period. The economic turmoil was so bad that even a reduction in inventory couldn’t staunch the price decline. But prices did eventually make a bit of a catch-up move to the upside in mid-2009 after the crisis had receded.
The second and quite a bit less dramatic breakdown has been underway since mid-2011. Despite inventory remaining under 6 months, prices have been steadily declining. It’s possible that the preponderance of foreclosures and short sales (perhaps helps along by higher unemployment and subdued economic growth) is keeping prices lower than they otherwise would be at similar levels of supply.
Now, though, inventory has dropped even lower (gone higher on the inverted chart), and these factors may not be enough to keep prices in the doldrums. The estimate for February’s Case-Shiller index (assuming it turns out to be right — it is calculated based on the past three months’ median price per square foot change) suggests that prices may have stopped declining at least for last month. It’s worth noting that prior to the current period, prices have always been rising, and usually pretty fast, when inventory was at or below 4 months. Foreclosures and high unemployment were a big issue for most of that period, too.
Inventory levels, as measured by the ratio between current supply and demand, say nothing about the longer-term prospects for housing, nor about exogenous factors that could come into play and change that ratio (the possibility of sharply interest mortgage rates is my favorite one to talk about). But the level of inventory can provide clues about price pressures in the months ahead. Should the rather dramatic tightness in supply persist, the near-term pressure for home prices could be to the upside.
Rich Toscano is a financial advisor with Pacific Capital Associates*. He can be contacted at rtoscano@pcasd.com.